
13 · Foundations
Building Your Watchlist
Strong names in strong sectors beat a perfect pattern on a weak stock, every time.
A great setup on a weak, illiquid, out-of-favor name will still underperform a merely decent setup on a leading stock in a leading sector. Before you scan a single chart, you need to know what the overall market is doing and which sectors are actually getting the flows.
Step 1 — Confirm the Market Regime
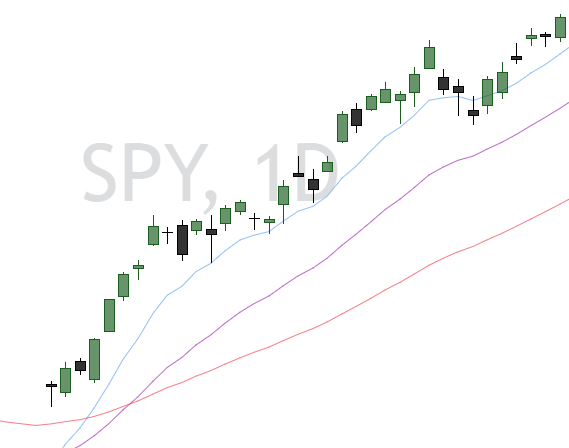
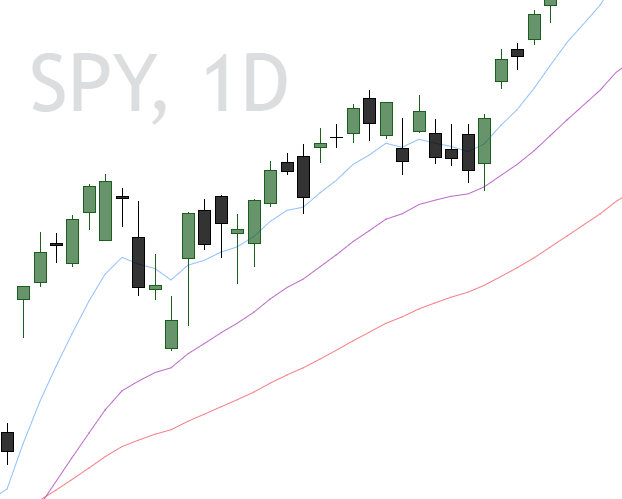
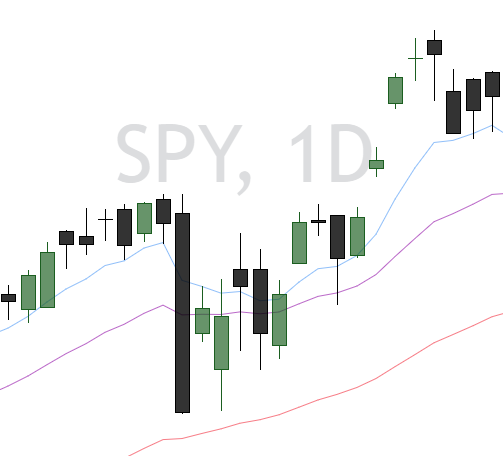
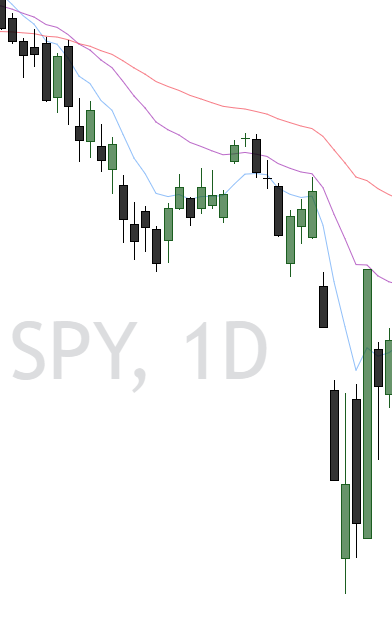
Apply the EMA stack from Module Four to the broad market indices first. If the market is stacked bullish, lean long and favor breakout setups. If the market is stacked bearish, either de-risk or start building a short watchlist. Trading against the tape makes every other edge in this book harder to execute.
Step 2 — Find the Leading Sectors
Use a sector heatmap to see which industry groups are leading over the past week, month, and three months. Sectors that show up near the top across multiple timeframes — not just a single hot week — are where institutional flows are currently concentrated.
Step 3 — Screen for Liquidity and Strength
Inside a leading sector, filter down to names that are actually tradable and already showing relative strength:
Baseline screening criteria
Price above $3. Avoids illiquid, low-quality names.
Average volume above 500k shares. Keeps you in names with real two-sided liquidity for options.
Price above its 20-period moving average. Filters for names already showing relative strength versus the rest of the sector.
Step 4 — Manually Confirm the Setup
Run your eyes over what’s left on the list and keep only names showing: a well-defined base forming near the highs, visible compression in the price action (a flag, wedge, or triangle), or a breakout that has just occurred with supporting volume. Add these to a dedicated watchlist and revisit it every session.
Setups We Return to Again and Again
Post-Earnings Base
A gap up following an earnings report, followed by a tight consolidation (flag, pennant, or wedge) over one to two weeks, with bullish volume — heavier on up days, lighter on pullbacks.
- Entry
- On a break of the consolidation.
- Invalidation
- The low of day for a shorter hold, or a daily close below the 8 EMA for a longer one.
- Target
- Measured from the consolidation, in line with the pattern rules in Module Eleven.
Accumulation Base at the Lows
A large consolidation near the bottom of a range, with volume increasing on up-moves and contracting on pullbacks — the accumulation signature from Module Seven.
- Entry
- When price reclaims and holds the top of the range.
- Invalidation
- A move back inside the range.
- Target
- The height of the range, projected from the reclaim.
Big Base at the Highs
Consolidation near all-time or 52-week highs during a hot market with leading sectors, typically flagging directly into the 8 EMA.
- Entry
- An inside-day entry on the 8 EMA, or a daily close above range highs.
- Invalidation
- The low of day, or a daily close below the 8 EMA.
- Target
- The depth of the base, projected from the breakout.