
11 · Foundations
Bullish Chart Patterns
Six repeatable shapes price leaves behind before it continues or reverses higher.
Patterns are simply visual shorthand for the supply-and-demand behavior we’ve already covered. Each one below comes with our entry, stop, and target rules — treat these as defaults to build discipline from, not rigid laws that never bend.
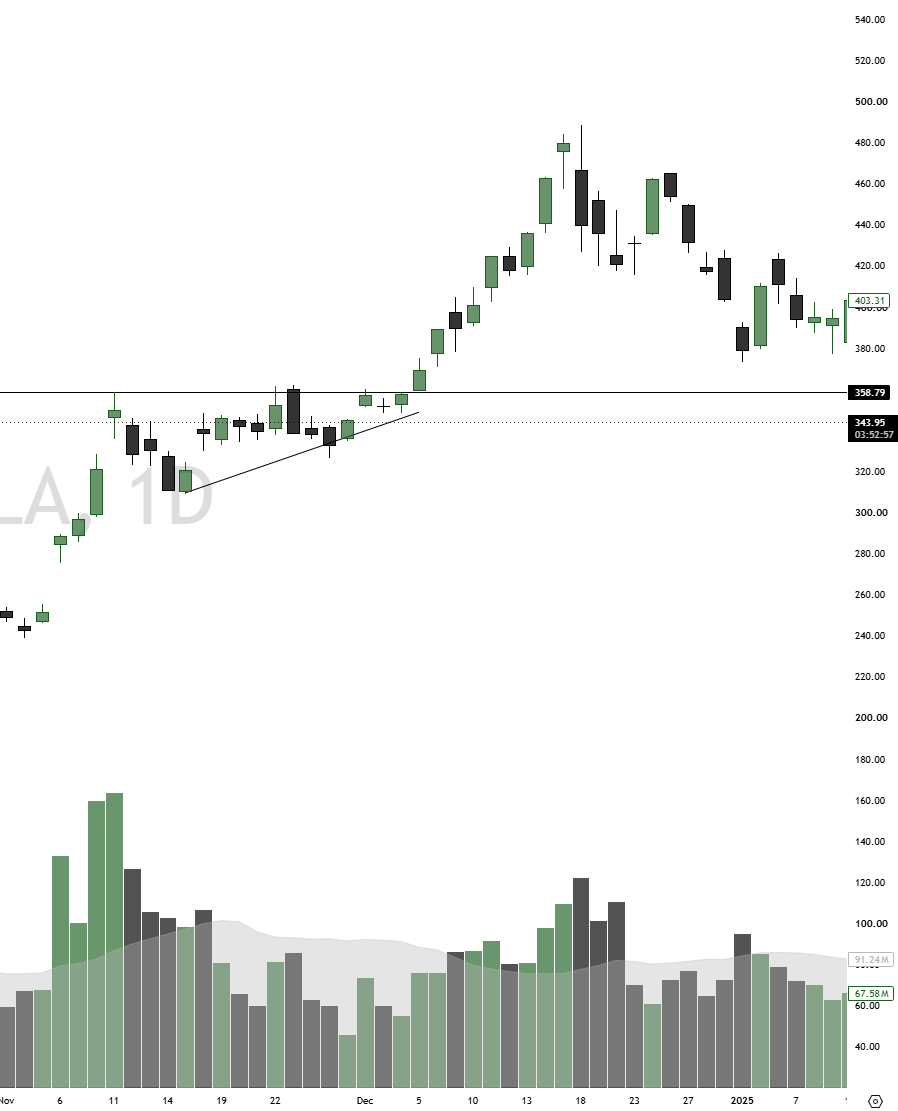
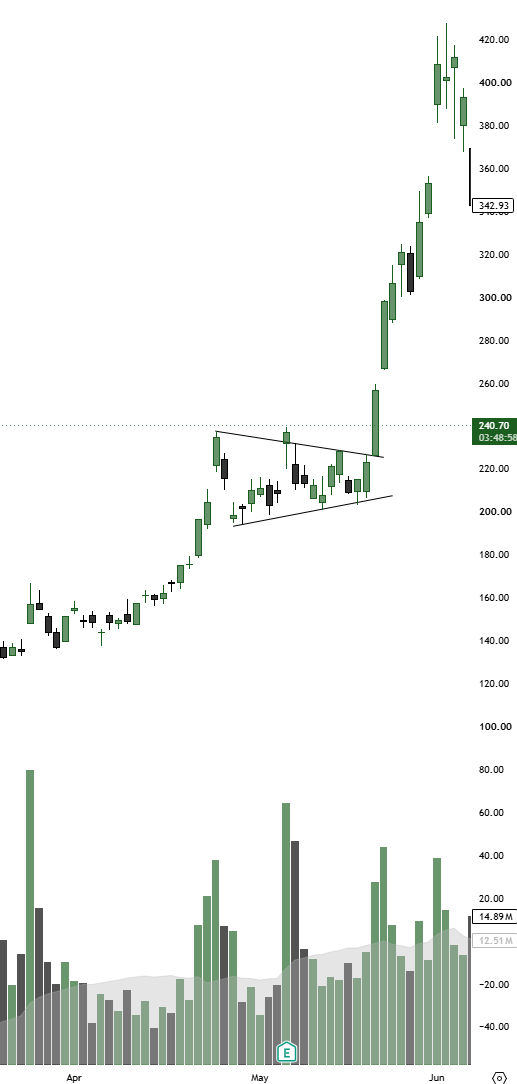
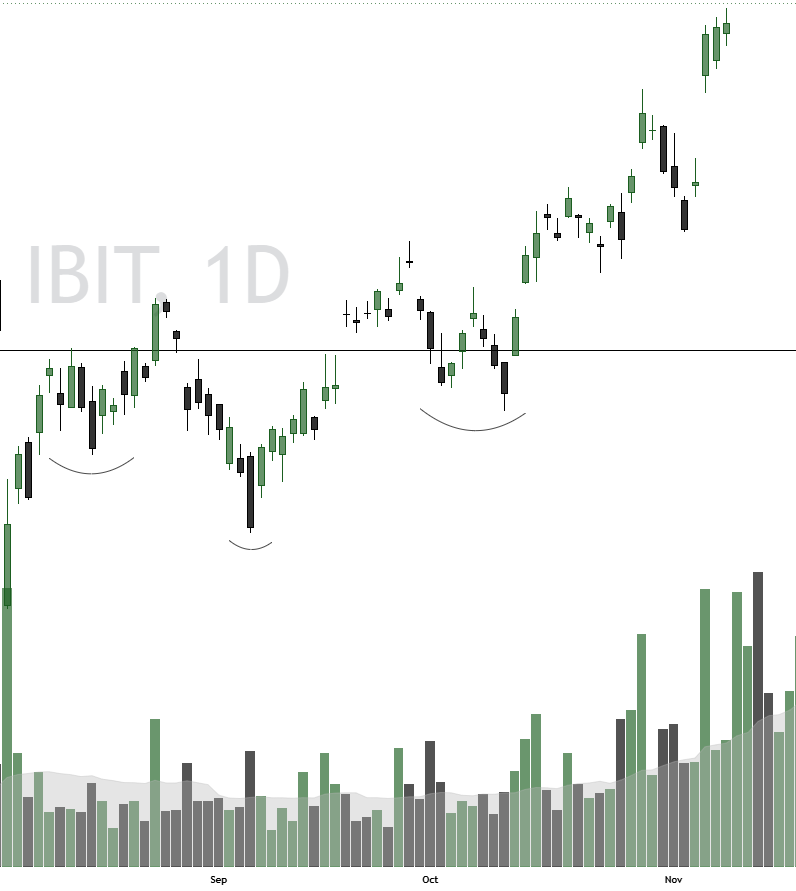
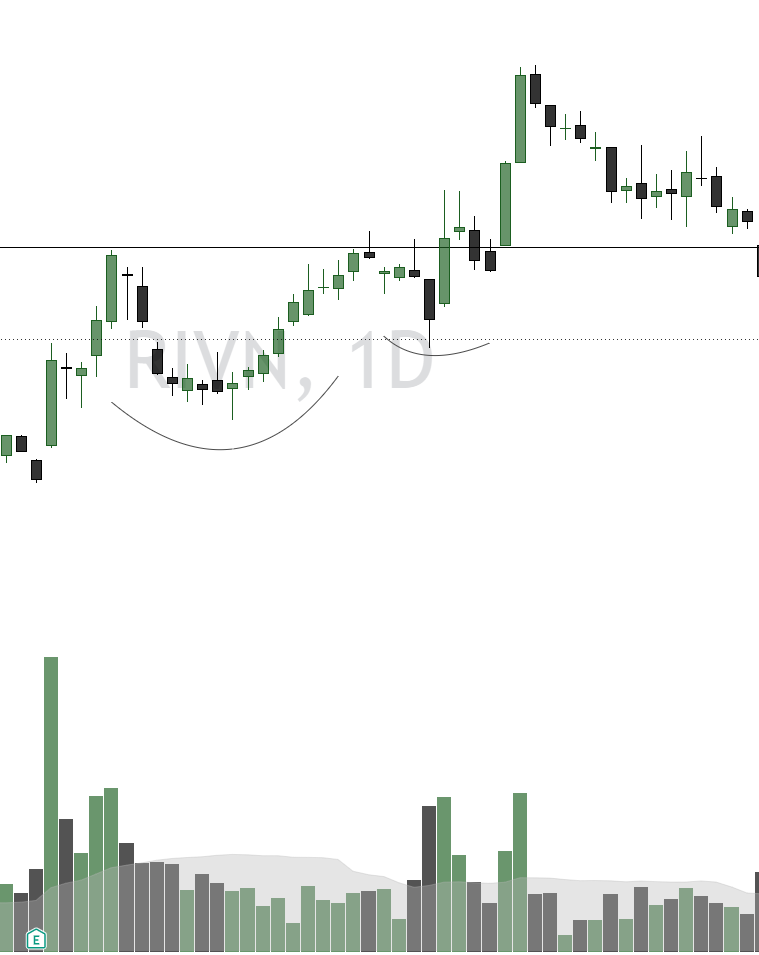
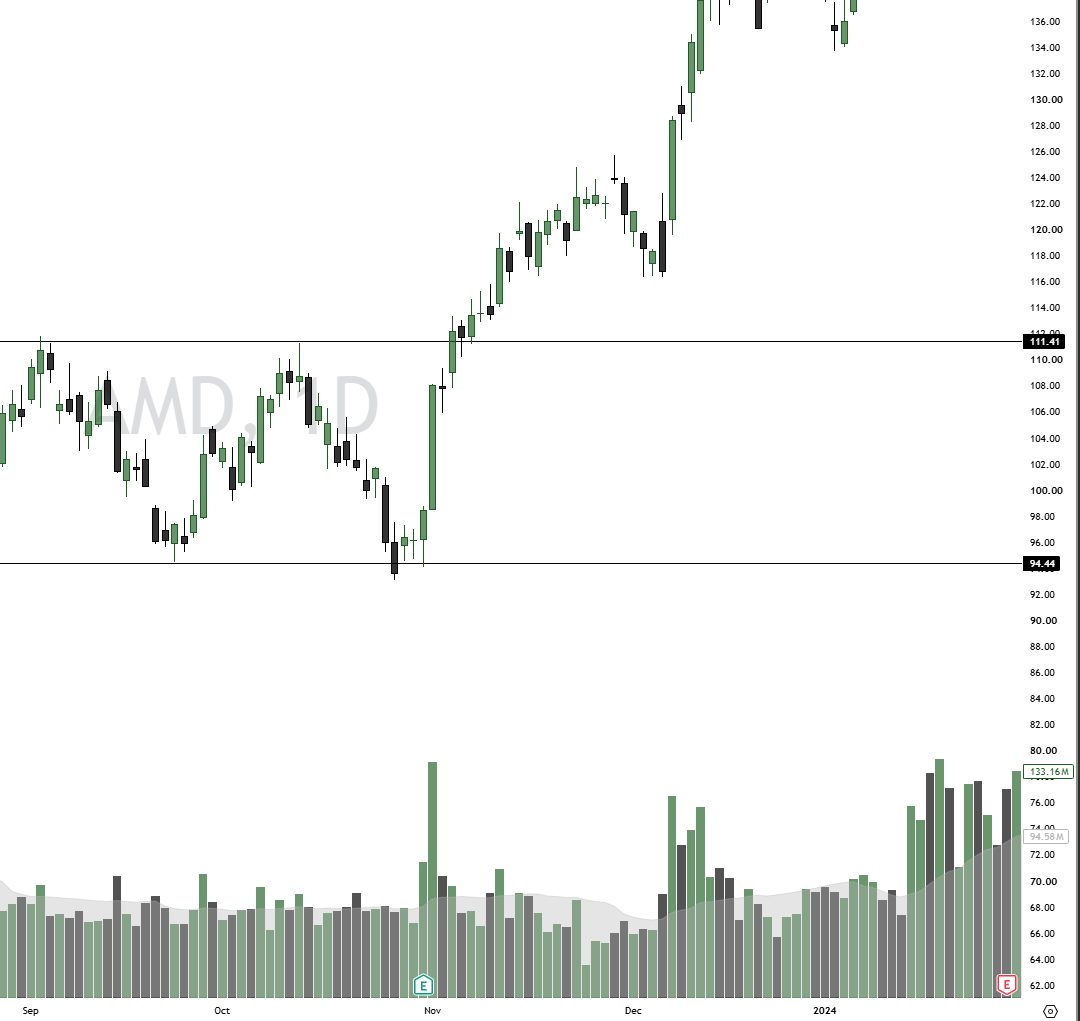
Ascending Triangle
Rising swing lows meet a flat horizontal resistance line, compressing price into a triangle.
- Entry
- Long on a support bounce, or on a confirmed break above resistance.
- Invalidation
- Below the most recent higher low.
- Target
- The height of the triangle, projected from the breakout point.
Bull Flag
A sharp vertical “pole” is followed by a tight, downward-sloping consolidation channel — the “flag.”
- Entry
- On a confirmed break of the flag’s upper trendline, ideally with a volume pickup.
- Invalidation
- Below the flag’s low.
- Target
- The length of the pole, projected from the breakout point.
Inverse Head & Shoulders
Three troughs — a shoulder, a deeper head, then a second shoulder roughly matching the first — with a neckline connecting the two peaks in between.
- Entry
- Long on a confirmed close above the neckline.
- Invalidation
- Below the right shoulder.
- Target
- The distance from the head to the neckline, projected from the breakout point.
Cup & Handle
A rounded, U-shaped base (“the cup”) is followed by a brief, shallow pullback (“the handle”) on lighter volume before the breakout.
- Entry
- Long on a break above the handle’s resistance.
- Invalidation
- Below the low of the handle.
- Target
- The depth of the cup, projected from the breakout point.
Double Bottom
Price makes a low, rallies, then returns to retest that same low a second time before reversing — forming a “W.”
- Entry
- Long on a bounce off the second low, or a confirmed break above the mid-pattern neckline.
- Invalidation
- Below the second low.
- Target
- The height of the W, projected from the breakout point.
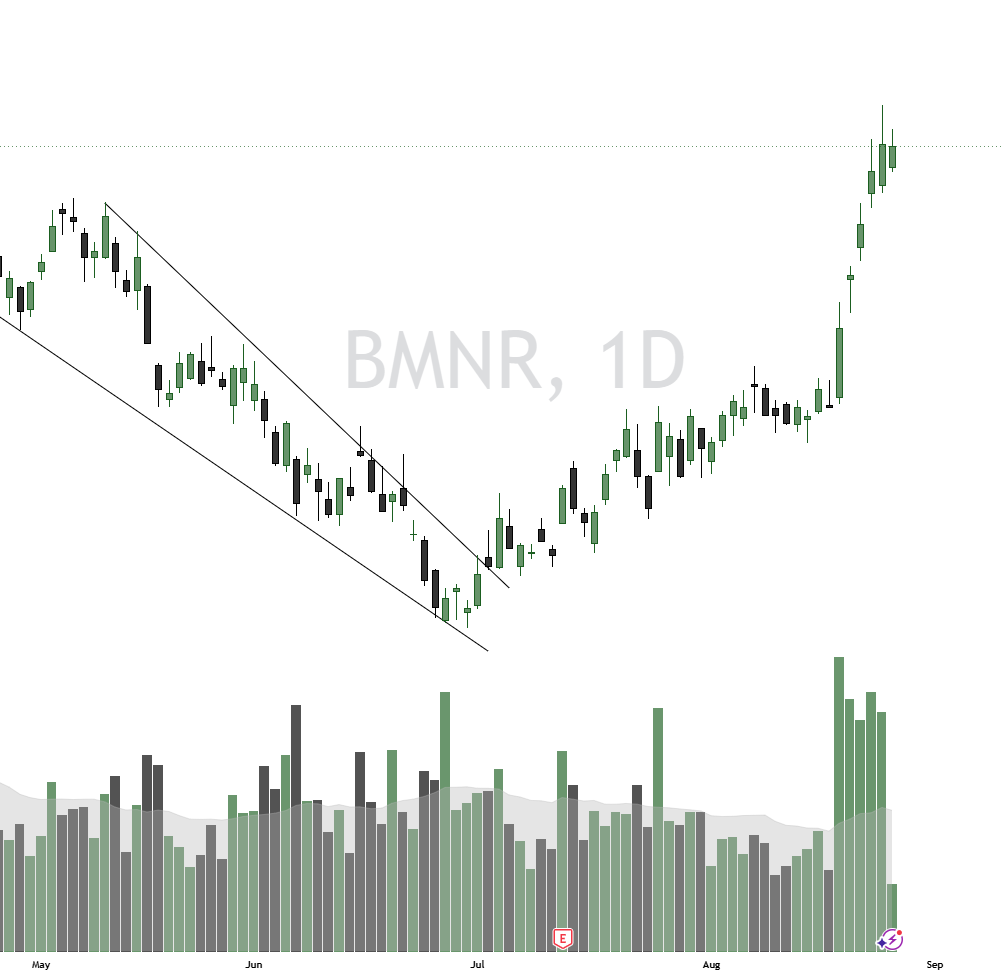
Falling Wedge
Both swing highs and swing lows slope downward but converge, showing selling pressure losing steam.
- Entry
- Long on a confirmed break above the upper wedge line.
- Invalidation
- Below the most recent low inside the wedge.
- Target
- The width of the wedge at its widest point, projected from the breakout.