The two lines every trader draws first — and the most misused tool in trading.
Support is a price level where a decline tends to pause or bounce because demand is concentrated there. Resistance is a price level where a rally tends to pause or reject because supply is concentrated there. Both can be drawn as horizontal lines connecting prior swing points, or as diagonal trendlines connecting a series of rising lows (support) or falling highs (resistance).
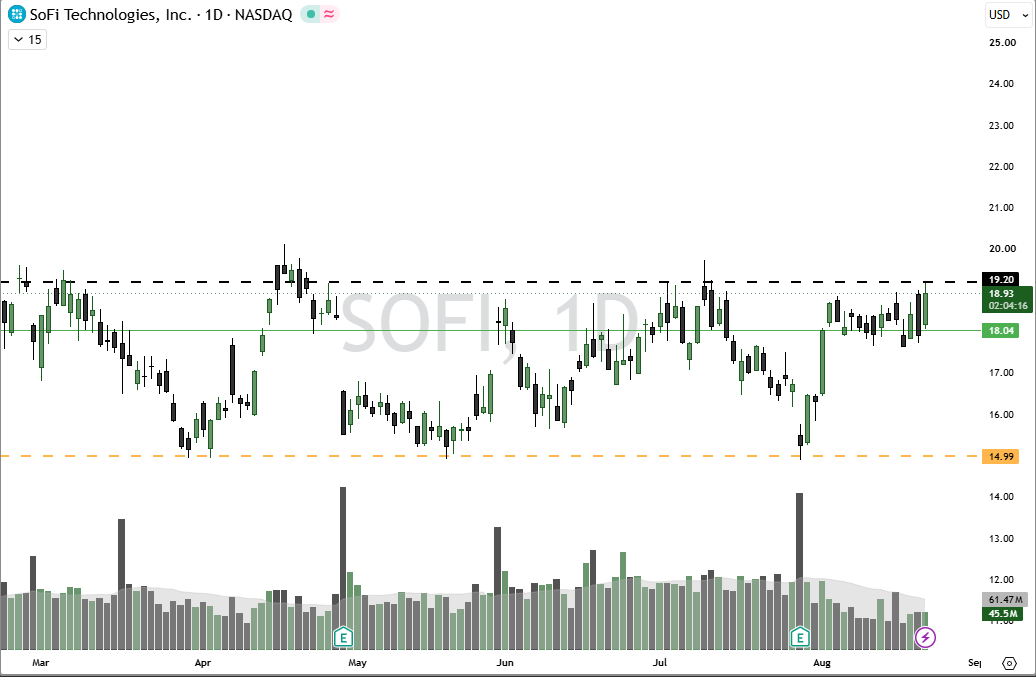
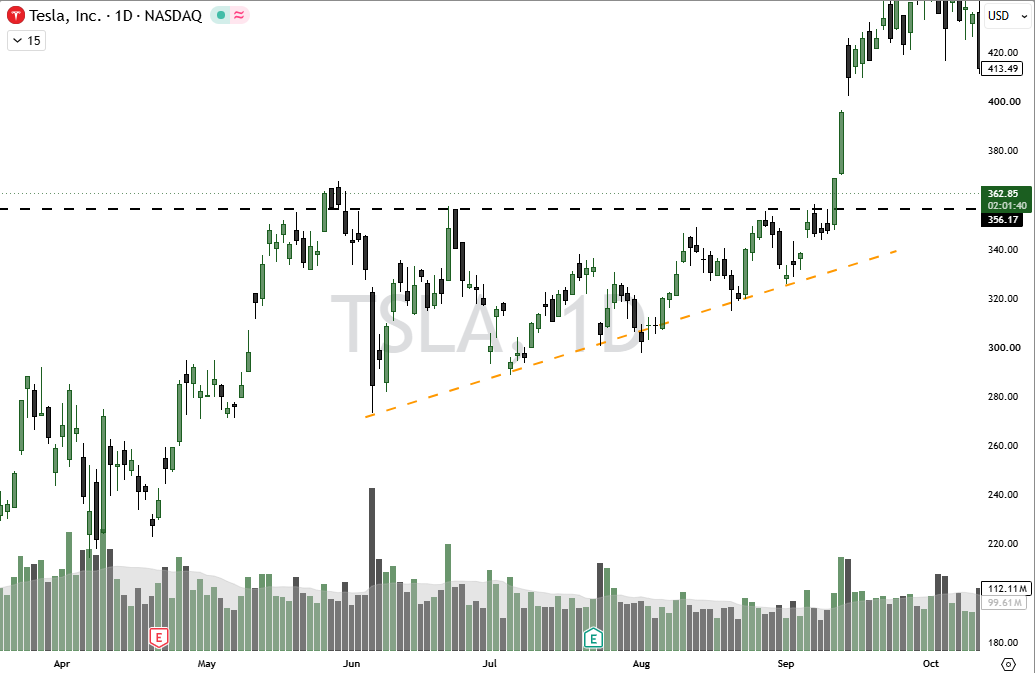
SOFI. Horizontal levels earn their place by being tested more than once. A line touched a single time is a coincidence.TSLA. A rising trendline is the same idea on a slope — it connects the higher lows and gives the uptrend something to break before the structure does.
How We Trade These Levels
At support
Wait for confirmation of a bounce before entering long. You are trying to catch the reversal off the level, not guess where it will hold. If support breaks instead of holding, that break is itself a signal a new downtrend may be starting.
At resistance
Wait for confirmation of a rejection before entering short. If resistance breaks instead of holding, that break is itself a signal a new uptrend may be starting.
The single biggest mistake traders make with support and resistance is treating a level as an exact price rather than a zone, and entering the instant price touches the line instead of waiting for it to actually react. A level only becomes useful once price proves it’s respecting it — that confirmation is what separates a real edge from a coin flip.
Trade it with us
Try the full TQE for $15
7 days of the full membership: the indicator suite, Gamma Levels, alerts, the private Discord and the live sessions. Cancel any time.