
10 · Foundations
Bearish Chart Patterns
Every tool in this book needs to work in both directions — down included.
These four patterns mirror the bullish setups you’ll find in Module Eleven. Learning both sides is what lets you trade whichever direction the market actually wants to go, instead of only ever looking for longs.
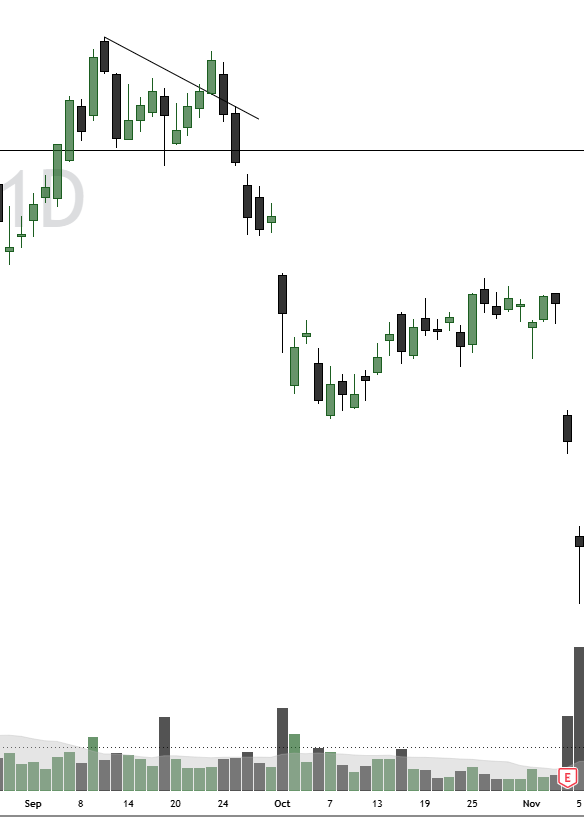
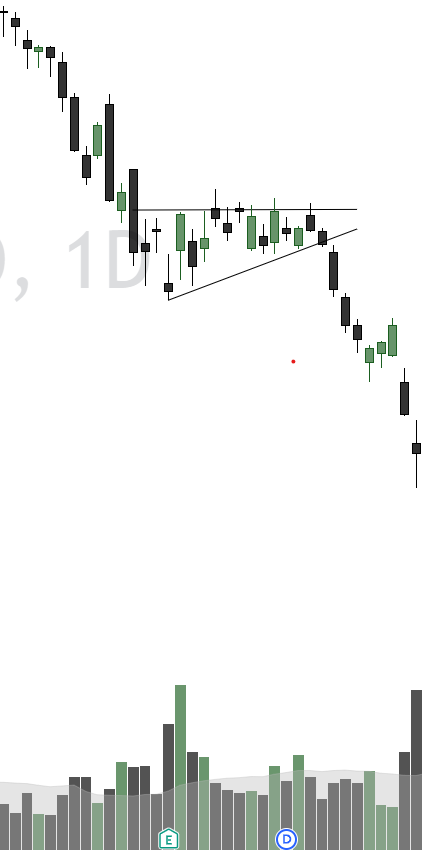
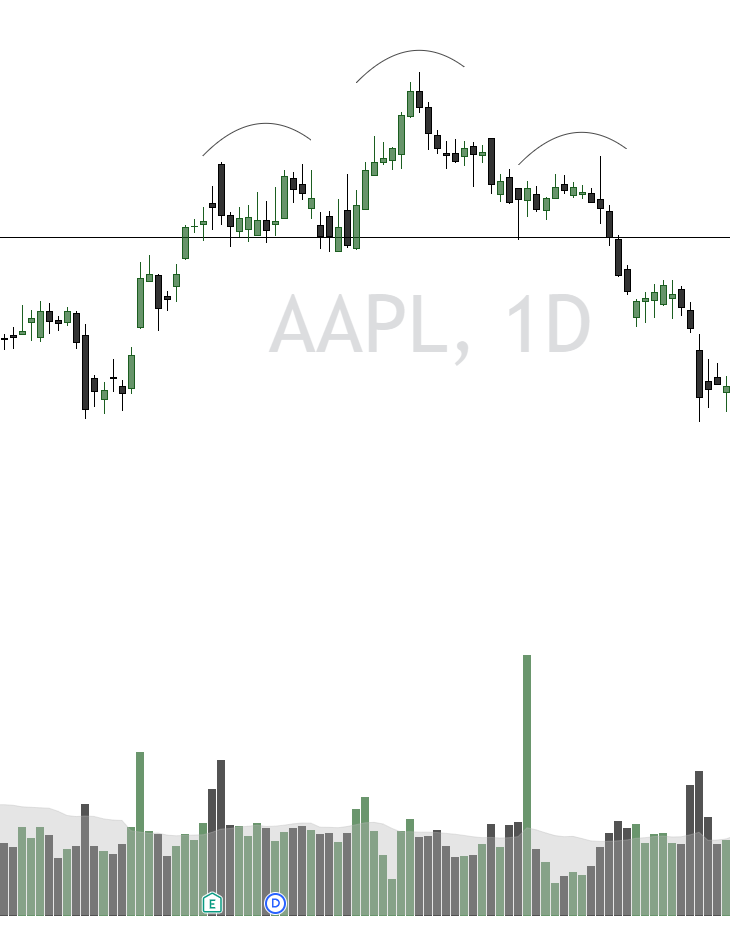
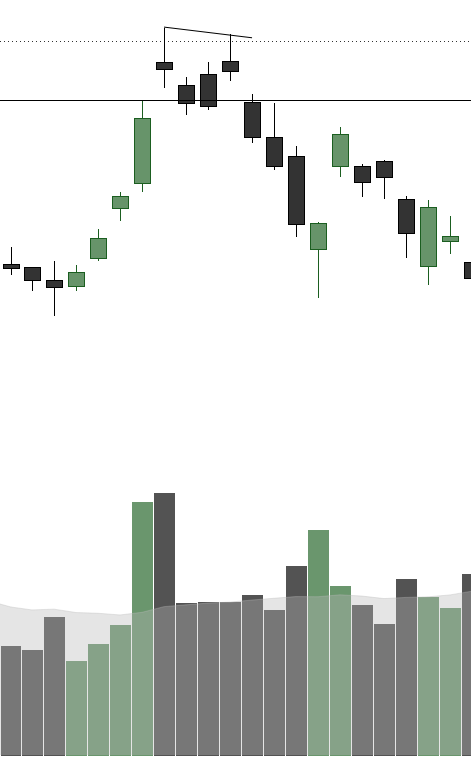
Descending Triangle
Falling swing highs meet a flat horizontal support line, compressing price into a triangle.
- Entry
- Short on a resistance rejection, or on a confirmed break below support.
- Invalidation
- Above the most recent lower high.
- Target
- The height of the triangle, projected from the breakdown point.
Bear Flag
A sharp vertical drop (“the pole”) is followed by a tight, upward-sloping consolidation channel — the flag.
- Entry
- Short on a confirmed break of the flag’s lower trendline.
- Invalidation
- Above the flag’s high.
- Target
- The length of the pole, projected from the breakdown point.
Head & Shoulders
Three peaks — a shoulder, a taller head, then a second shoulder roughly matching the first — with a neckline connecting the two troughs in between.
- Entry
- Short on a confirmed close below the neckline.
- Invalidation
- Above the right shoulder.
- Target
- The distance from the head to the neckline, projected from the breakdown point.
Double Top
Price makes a high, pulls back, then rallies to retest that same high a second time before reversing — forming an “M.”
- Entry
- Short on a rejection off the second high, or a confirmed break below the mid-pattern neckline.
- Invalidation
- Above the second high.
- Target
- The height of the M, projected from the breakdown point.