
03 · Foundations
Market Structure & Trend
Before you ask “should I buy this,” ask “what is this stock actually doing.”
Trend is the single biggest edge you can trade with, and it’s also the most commonly ignored. Structure tells you what a stock is doing without any indicators at all — just the pattern of highs and lows it leaves behind.
Higher Highs & Higher Lows
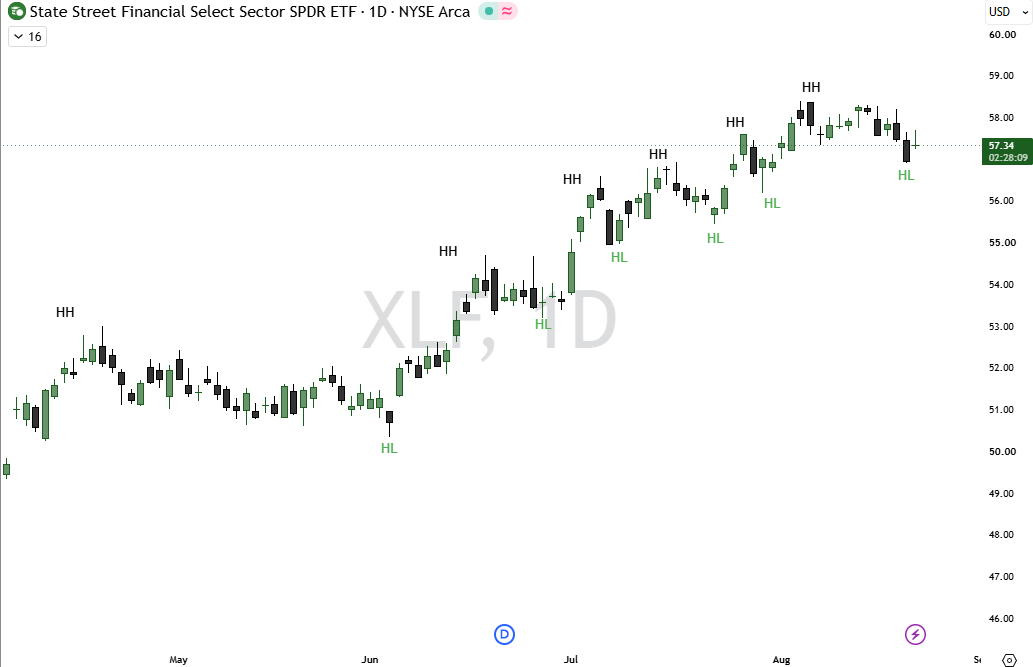
A Higher High forms when a swing peak sits above the previous swing peak — buyers are willing to pay more than they were last time. A Higher Low forms when a swing trough sits above the previous swing trough — buyers are stepping in earlier on pullbacks, not waiting for a deeper discount. Together, Higher Highs and Higher Lows confirm an uptrend is intact.
Lower Highs & Lower Lows
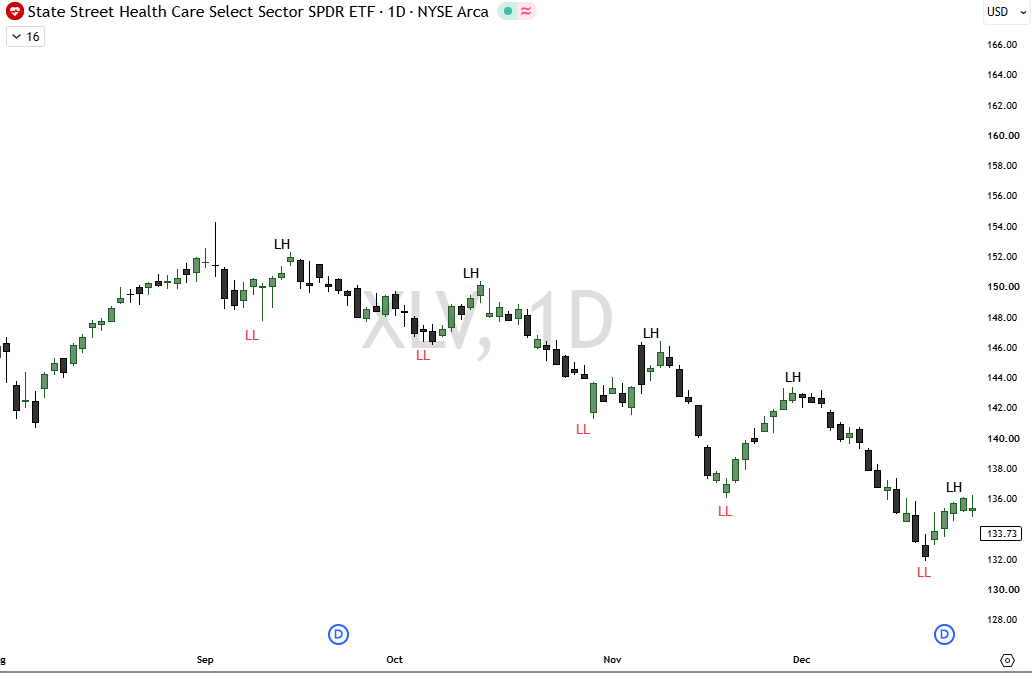
The mirror image applies in a downtrend. A Lower High forms when a swing peak sits below the previous peak — sellers are capping rallies earlier each time. A Lower Low forms when a swing trough sits below the previous trough — sellers are willing to accept less each time they distribute. Together they confirm a downtrend is intact.
Structure is also your first and fastest filter. Before applying any indicator or pattern from the rest of this book, glance at the chart and ask: is this making higher highs and higher lows, lower highs and lower lows, or is it just chopping sideways? That one observation tells you more about the odds of your trade working than almost anything else you’ll learn.