
07 · Foundations
Volume & Price Analysis
Volume is the fuel. Price is just where the fuel takes it.
If structure tells you the direction and the EMA stack tells you the trend’s health, volume tells you whether either of those things can be trusted. Volume measures liquidity and participation — how many shares actually traded — and it is the closest thing we have to a window into institutional activity. Price can be pushed around briefly by thin trading. Volume is much harder to fake.
Volume as Confirmation
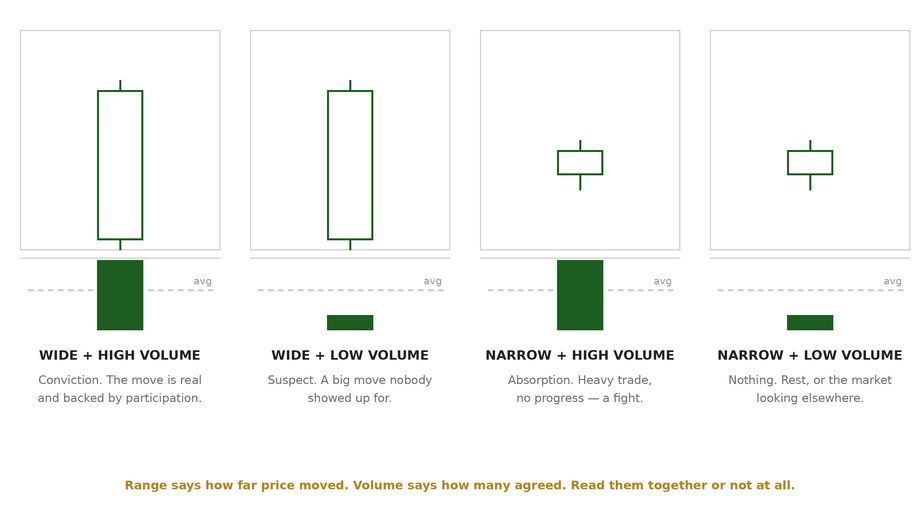
A wide-range candle backed by high volume is a move you can trust — real size is behind it, most likely institutional. A wide-range candle on low volume is a red flag: the move happened without real participation and is more likely to fail or reverse. The same logic runs in reverse for narrow-range candles: low volume on a quiet candle is normal, but high volume on a candle that barely moved is an anomaly worth watching — it often means a large player is absorbing supply or demand quietly before the next expansion.
The four combinations
Wide range + high volume. Confirmed move. Real participation is behind it.
Wide range + low volume. Anomaly — no fuel. More likely to fail or reverse.
Narrow range + high volume. Anomaly — hidden effort. Someone is absorbing quietly.
Narrow range + low volume. Normal, quiet trade. Nothing to act on.
Accumulation & Distribution
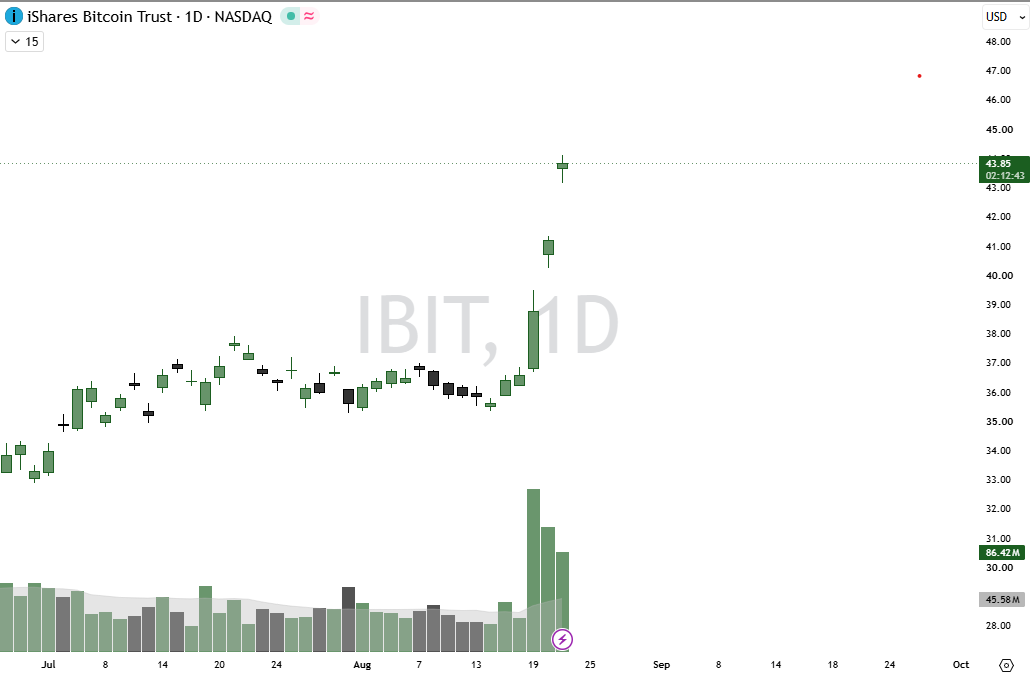
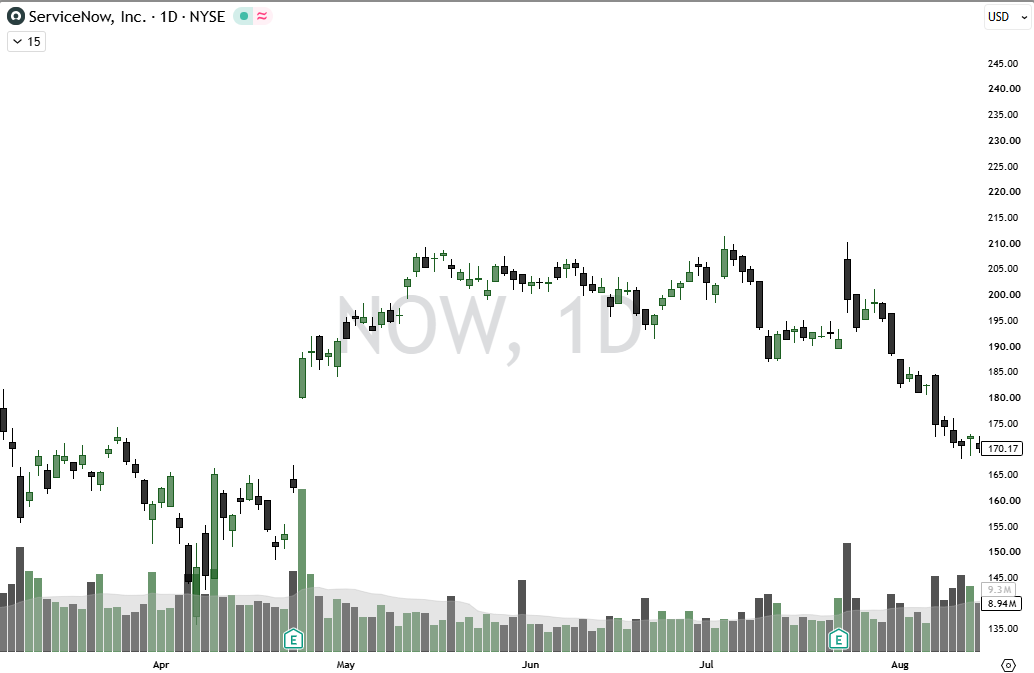
Accumulation shows up as elevated volume on up-days near the lows of a range, with lighter volume on the pullbacks in between — a signature of buyers building a position without a large public push in price. Distribution shows up as elevated volume near the highs of a range, often around a failed breakout that traps late buyers before institutions unload into that demand.
The Ignition Candle
An ignition candle is an outsized, high-volume candle that moves aggressively in one direction relative to its recent average range — the first clear signal that a stock is on the radar of larger players. Once you spot one, the play is not to chase it. Add the name to your watchlist and wait for the pattern that follows: pullbacks on lighter volume, resumptions on heavier volume. That rhythm is evidence institutions are still adding to their position rather than cashing out.
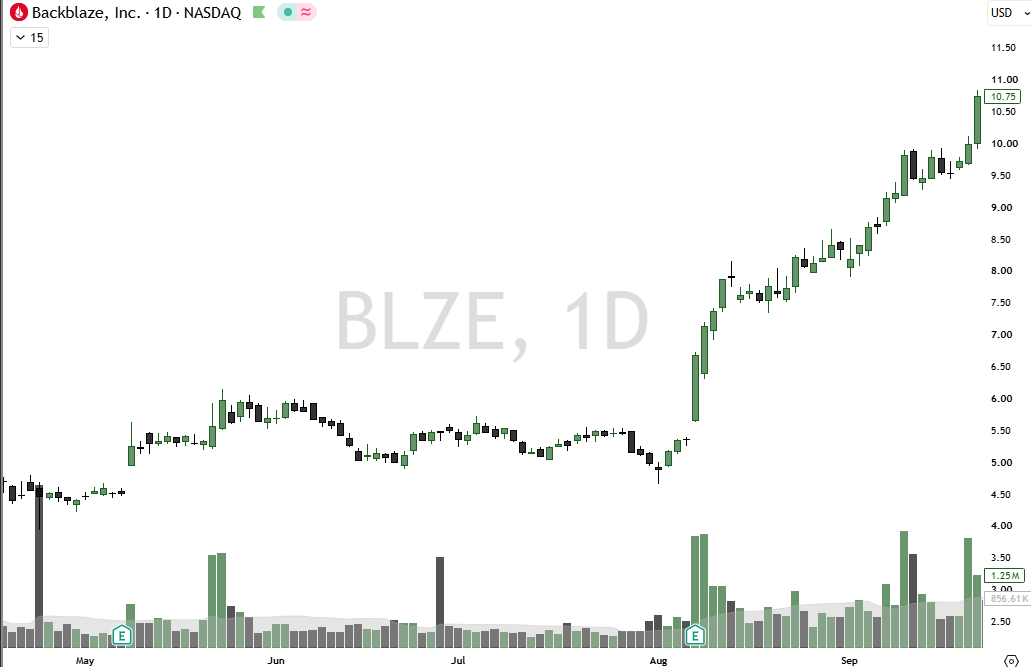
Find the ignition. Scan for outsized range and volume relative to the recent average — this puts a name on your radar.
Wait for the base. Let the stock consolidate. A tight flag or a longer base both work; bigger bases tend to produce bigger moves.
Confirm with volume. You want to see the accumulation signature — volume expanding on up-moves, contracting on pullbacks.
Enter before the crowd. The goal is a position before the move is obvious to everyone else, while implied volatility on the options is still cheap.