
04 · Foundations
The EMA Stack
Three moving averages, one read on trend health.
An Exponential Moving Average (EMA) tracks the average price of a stock over a set number of periods, weighting recent price action more heavily than older data. That weighting is what makes it more responsive than a Simple Moving Average — it reacts faster when a trend is genuinely shifting instead of lagging behind stale data.
TQE runs three EMAs on every chart: the 8, the 21, and the 50. Each one answers a different question. The 8 EMA shows you short-term momentum — is price still being bought aggressively right now? The 21 EMA shows you the intermediate trend — is the broader move still intact? The 50 EMA shows you the higher-timeframe trend and often acts as a magnet for larger pullbacks.
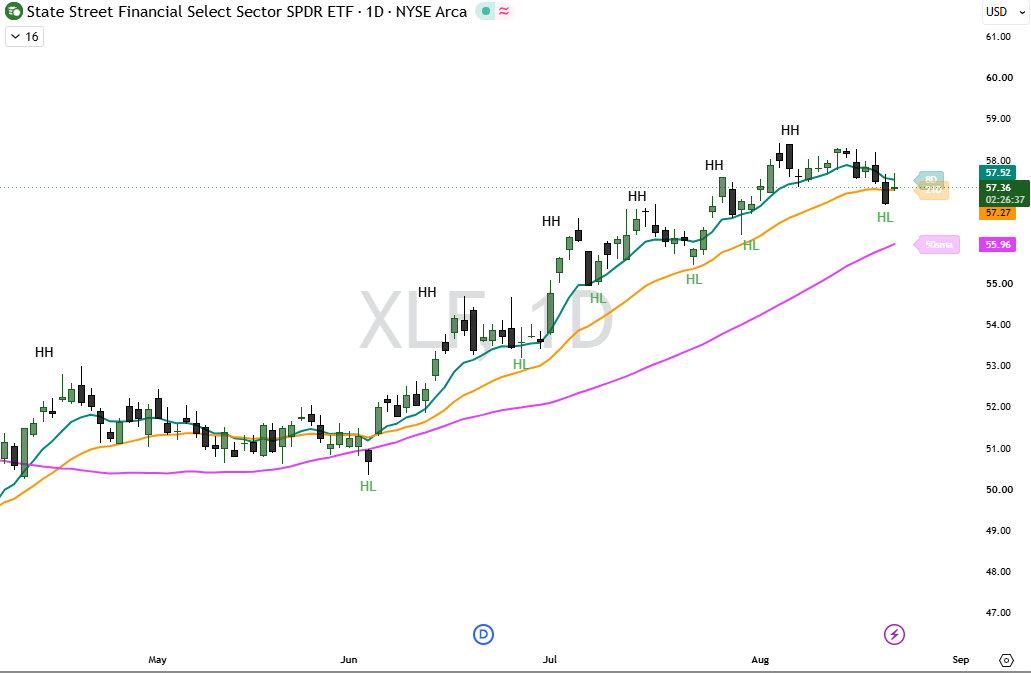
Reading the Stack
The order of the three lines relative to price is the whole read. Click through each condition to see what it means and what to do about it: