
06 · Foundations
Volume Profile
Where has the market already spent the most time transacting — and why does it matter now.
A volume profile shows how much trading volume has occurred at each price level over a given period, rather than over time. The result is a horizontal histogram laid across your chart: tall bars mark prices where a large amount of business was transacted, thin bars mark prices the stock passed through quickly. Those tall bars — volume shelves — are where a meaningful number of traders already have a position, and that fact alone gives those levels gravity.
Volume Shelves as Support
When price falls back down into a volume shelf, you can expect buyers who are already positioned there, plus new buyers attracted by the level, to defend it. The shelf tends to act as a floor and a springboard for the next move higher.
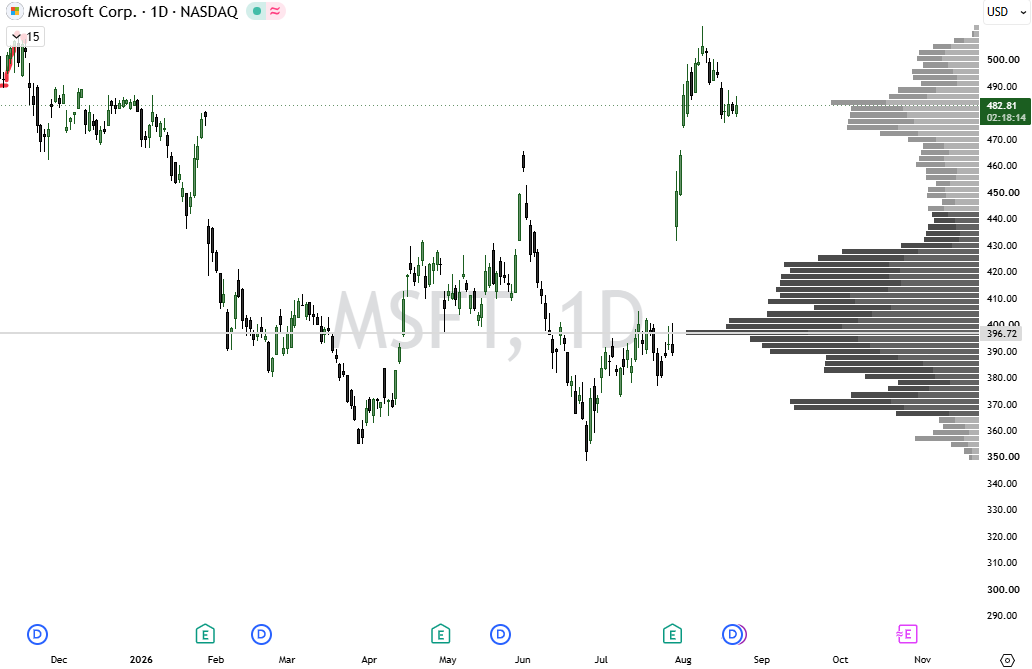
Volume Shelves as Resistance
When price rallies up into a volume shelf from below, traders who bought at that level previously and are now just getting back to breakeven tend to sell to exit — increasing supply right where the stock needs demand to keep climbing. That makes the shelf harder to clear on the first attempt.
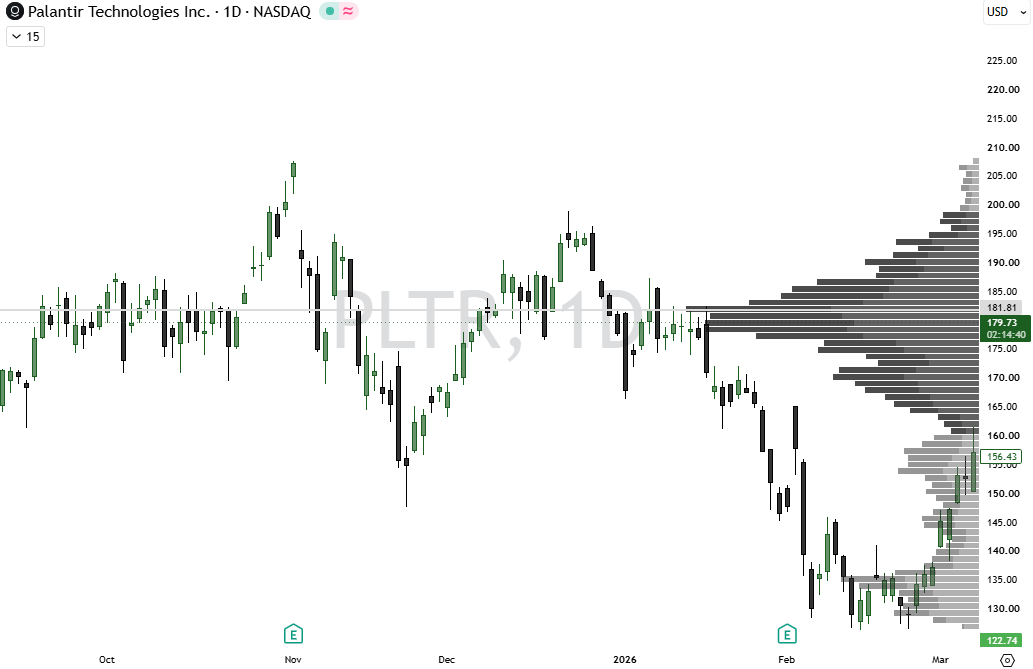
Volume profile is not a standalone trading system — it’s a map. It tells you where the crowd already has skin in the game so you can anticipate where price is likely to react, well before it gets there.