
Advanced 02 · Advanced
Gamma Exposure & Dealer Positioning
Why price keeps stalling at the same round numbers — and who is forced to trade there.
Every module before this one reads price. This one reads the people who are forced to trade against it. When you buy an option, somebody sold it to you — and that somebody is usually not a speculator with a view. It is a dealer whose job is to provide liquidity and who is now carrying a risk they did not want and are not allowed to keep. What they do to neutralise that risk shows up on your chart as levels price seems to respect for no visible reason.
Who Is on the Other Side
Options are derivatives — their value comes from something else. $SPX options derive from the S&P 500 itself and settle in cash; $QQQ options derive from the QQQ ETF, which tracks the Nasdaq-100, and settle in shares of it. What you are buying is the right, but not the obligation, to transact at a fixed strike price — or, on a cash-settled index contract, to be paid the difference.
Most of the time, the counterparty is a dealer or market maker. Their entire business is providing liquidity — quoting a price on both sides so the market functions. They are not speculating on direction, and their mandate and risk limits do not let them carry much of it for long. They make money on spread and on volatility, not on being right about where $SPY closes.
Option holders — risk acquisition
You chose this exposure. You wanted delta, you paid for it, and you can walk away from it whenever you like. Your risk is a decision.
Option dealers — risk inheritance
They took the other side because someone had to. The exposure was handed to them, they did not want it, and they must actively neutralise it. Their risk is an obligation.
Delta and Gamma, Briefly
Four Greeks describe how an option’s price responds to what moves around it. Delta measures how much the premium moves per $1 move in the underlying. Theta measures what time costs. Vega measures sensitivity to implied volatility. And gamma measures how fast delta itself changes as the underlying moves.
Delta is velocity
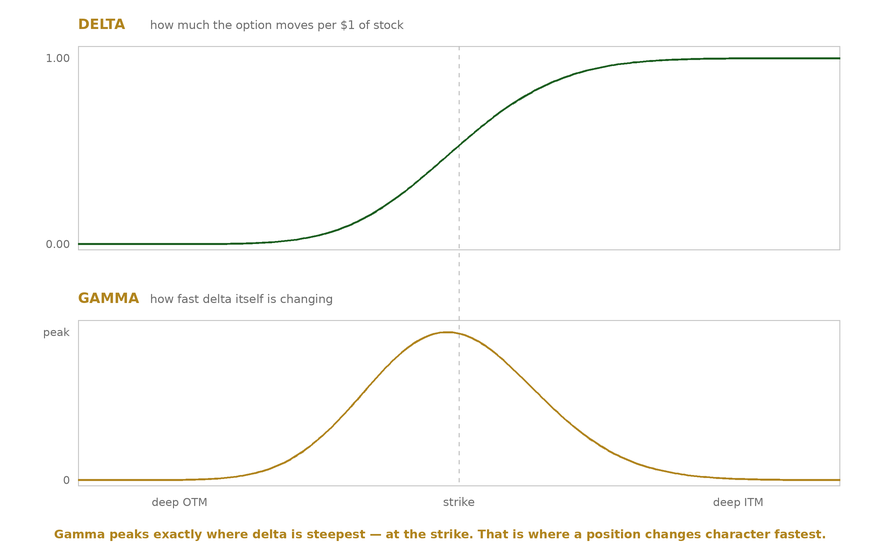
Plotted against price, a call’s delta traces an S-curve from 0 to 1 — a put’s runs from −1 to 0. Near-flat far from the strike, steepening sharply through it, flattening again well past it. It describes how much directional exposure a position currently carries.
Gamma is acceleration
Gamma is the steepness of that curve — it peaks right at the strike, and for strikes near the money it climbs steeply into expiration. Away from the money it does the opposite and decays toward zero. It describes how violently that directional exposure changes when price moves.
Delta describes the directional exposure of a position.
Gamma describes how quickly that exposure changes underneath you.
Why Dealers Must Hedge
A dealer who has inherited a book of options is carrying delta they never asked for. Because they cannot speculate, they must return to delta neutral — and the only way to do that is to take an offsetting position in the underlying itself.
The book acquires delta. Customer flow leaves the dealer net long or net short directional exposure.
The dealer offsets it in the underlying. Long delta gets hedged by selling shares or futures; short delta gets hedged by buying them.
Price moves, and delta changes again. This is gamma. The hedge that was correct a moment ago is now wrong.
They re-hedge. Continuously. All day, in whatever size the book demands, regardless of what they think the market is going to do.
The Two Regimes
Everything above resolves into one question that changes how a whole session behaves: is dealer positioning long gamma or short gamma? The answer determines whether their forced hedging fights the move or feeds it.
Positive (long) gamma — suppression
Dealers hedge against the move: selling into strength, buying into weakness. The effect is a market that mean-reverts, ranges, and grinds. Rallies get sold before they extend, dips get bought before they break. Breakouts fail more often than they work.
Negative (short) gamma — amplification
Dealers hedge with the move: buying into strength, selling into weakness. The effect is a market that trends, accelerates and gaps. Moves that would normally stall keep going, and downside gets disorderly. Breakouts run.
The Levels
Aggregate all of that positioning across every strike and you get net gamma exposure — GEX. Plotted by strike, it produces a small set of levels that map where dealer hedging is concentrated:
The levels that matter
Call wall. The strike where call-related gamma exposure is greatest. Dealer hedging feedback is strongest here, which is why it so often behaves as a ceiling.
Put wall. The same thing on the downside — the strike with the largest put-related gamma concentration, and the level that most often behaves as a floor.
High Volatility Level (HVL). The price where the gamma regime flips. Above it you are usually in the suppressive regime; below it, the amplifying one. It is a modelled estimate of that flip, smoothed rather than raw — which is exactly why it is the one to trade off.
Zero gamma. The raw price at which net dealer gamma sums to zero. It normally sits on or very near the HVL, because the two are measuring the same thing in different ways. When they disagree, use the HVL — the raw crossing is the noisier of the two.
/img/15-gex-levels.pngHow Price Behaves at a Wall
There are only two outcomes when price reaches a gamma wall, and they are opposites — which is exactly why the level is worth watching. Either the wall holds and hedging pushes price back, or demand overwhelms the inventory sitting there and the regime flips.
Call Wall — Bounce
The default outcome in a long gamma regime. Gamma is greatest at this strike, so as price climbs toward it dealer delta rises fastest right here — and continuous re-hedging means selling the underlying into the advance. Holders taking profit and selling contracts back to dealers pushes the same way. Price gets progressively more suppressed the closer it gets to the level.
- Entry
- Fade into the wall only with a confirming signal from the chart — rejection candle, momentum divergence, a failed push. Never on the level alone.
- Invalidation
- Above the wall, at the point where a decisive reclaim proves the level is being taken out.
- Target
- The mid-range, or the next level down. Suppression is a range condition, not a trend condition.
Call Wall — Breakout
If fresh call demand emerges strongly enough near the wall, dealers keep writing calls until they are short enough gamma at that strike to overwhelm the positioning that was suppressing price there. Note this is a local flip at one strike, not the session-wide regime change the HVL marks. The wall stops defending, and hedging around that level starts chasing the move instead of fading it.
- Entry
- On a confirmed reclaim and hold above the wall, ideally with the volume expansion Module Twelve asks for on any breakout.
- Invalidation
- Back below the level. If the flip was real, price should not return under it.
- Target
- The next strike concentration above. Once the regime flips, moves tend to extend further than they look like they should.
Put Wall — Bounce
The mirror image, and the more common outcome. Gamma is greatest at this strike, so as price falls toward it dealer delta drops fastest right here, and re-hedging means buying the underlying into the decline. Holders closing puts back to dealers pushes the same way. That buying is what turns the strike into a floor.
- Entry
- Long on a confirmed reaction off the level — reclaim candle, higher low, absorption. The level sets the location; the chart still has to give you the trigger.
- Invalidation
- Below the wall. A clean break through it means the assumption you entered on is gone.
- Target
- Back toward the mid-range or the call wall above.
Put Wall — Breakdown
If put demand is strong enough to leave dealers short gamma at that strike, the positioning that was defending it flips. Hedging turns destabilising: they sell into weakness, into a market that is already falling. This is the mechanism behind sessions that unravel faster than the news seems to justify — and unlike the call-wall case, it usually means price is heading below the HVL too, so the local flip and the session-wide one reinforce each other.
- Entry
- Short on a confirmed break and failed retest of the level. Do not front-run the break — the bounce case is the more common one.
- Invalidation
- Back above the broken wall. The old floor should now act as resistance; if price reclaims it, the flip did not hold.
- Target
- The next put concentration below. Expect a faster, less orderly move than the regime above the HVL produced.
What This Actually Changes
Gamma exposure is context, not a signal. It does not tell you to buy anything. It tells you which of the two markets you are trading in today, and where the forced flow is concentrated — and that changes which of your existing setups you should trust.
- Above the HVL, in long gamma, treat breakouts with suspicion. Mean reversion is the house edge. Fading extremes back into the range works far better here than it does anywhere else, and this is the regime where your best trades are usually smaller and quicker.
- Below the HVL, in short gamma, treat pullbacks with suspicion. Trends extend, stops get run, and the tidy retest you are waiting for often never arrives. Size down — the same stop distance carries more risk of being caught in a disorderly move.
- Use the walls as level candidates, not as trades. Everything Module Eight said about support and resistance still applies: the level marks the location, and the chart still has to produce the trigger.
- Watch where the walls sit relative to price at the open. Price pinned between a nearby call wall and put wall is a range day until proven otherwise. Price sitting right on the HVL is the least predictable configuration on the board.
- Respect that this is index-driven. GEX mechanics matter most in the heavily-traded index products. On a mid-cap single name with thin options volume, dealer hedging is not what is moving your chart.
Structure tells you where the level is.
Gamma tells you who is being forced to defend it.
Where This Stops Being Free
Everything in this module is public market mechanics. You can go and read about dealer hedging anywhere, and you now understand it well enough to know what you are looking at. What you do not have is the only part that is worth anything on a given morning: today's numbers.
Gamma exposure has to be computed from live options positioning across every strike, and it has to be refreshed as that positioning changes through the session. Knowing what a call wall is does not tell you where today's sits, and a level you cannot keep current is a level you should not trade.